A study on how the effectiveness of advertising campaigns depends don’t the number of channels involved
By Mark Vroegrijk
Senior Specialist Data, Science & Analytics
Nowadays, it has become common practice for brands to spread their advertising efforts across multiple media channels. Instead of solely focusing on traditional, broadcast-based media such as TV and radio, most campaigns incorporate static (print and out-of-home) and/or online (display, pre-rolls and social platforms) channels into their media mix as well. This may improve the campaign’s overall effectiveness by increasing both its reach (because not every consumer uses the same channels) and frequency of exposure (because the campaign now uses multiple “touchpoints” through which it can reach consumers during the day). In a previous study, we indeed found that exposure to a campaign across multiple channels can considerably foster consumers’ ability to recall the advertising brand afterwards.
At the same time, this study defined multi-channel exposure as being exposed to two channels rather than one. But in reality, the number of channels via which brands distribute their advertising spending is (much) greater. On each of those channels, creatives from other advertisers compete for the consumer’s attention as well and add a certain amount of “noise” that makes it more difficult for brands to clearly get their message across. This begs the question of whether spreading one’s advertising efforts across a large number of channels would still leave sufficient pressure per channel to stand out still – and actually “break through the clutter”.
These two opposing arguments on why adding more channels to one’s media mix may or may not turn out to be beneficial for the advertising brand, got us interested in assessing to what extent – and how – the effectiveness of marketing campaigns is dependent on the number of channels. Therefore, we set out to answer this question through a meta-analysis, as further described below.
We wanted to find out how and to what extent the impact of advertising is driven by the number of channels across which one advertises. Therefore, we built a (week-level) data set that was sourced from our brand trackers. This data set includes the following information:
Aided advertising awareness: For each brand and week in our data set, this variable captures the share of survey respondents that select that brand after being asked “For which brand(s) do you remember seeing or hearing any advertising during the past few weeks?”.
Media pressure (across 8 channels): For each brand and week in our data set, these variables reflect the number of media contacts that were realised by that brand’s advertising efforts. We take 8 different channels into account: 1) TV, 2) Radio, 3) Print, 4) Out-of-home, 5) Pre-rolls, 6) Social, 7) Online search, 8) Online display.
We then further expand this data set by constructing two additional variables:
RPS (Reality Performance Score): At DVJ Insights, we use RPS to represent the overall media pressure that is realised by a brand’s weekly advertising efforts (relative to the size of the market in which it operates). RPS takes into account that:
-
- Each channel differs in the likelihood of advertisements being noticed and recalled by consumers.
- Consumers are usually able to remember advertisements for at least some time after seeing or hearing them. Therefore, part of the advertising efforts in one week still has value in the following weeks.
Several deployed channels: We obtain the number of channels that are involved in a brand’s weekly advertising efforts by counting the channels on which more than 0 were realised. We count contacts across 8 different channels as mentioned above.
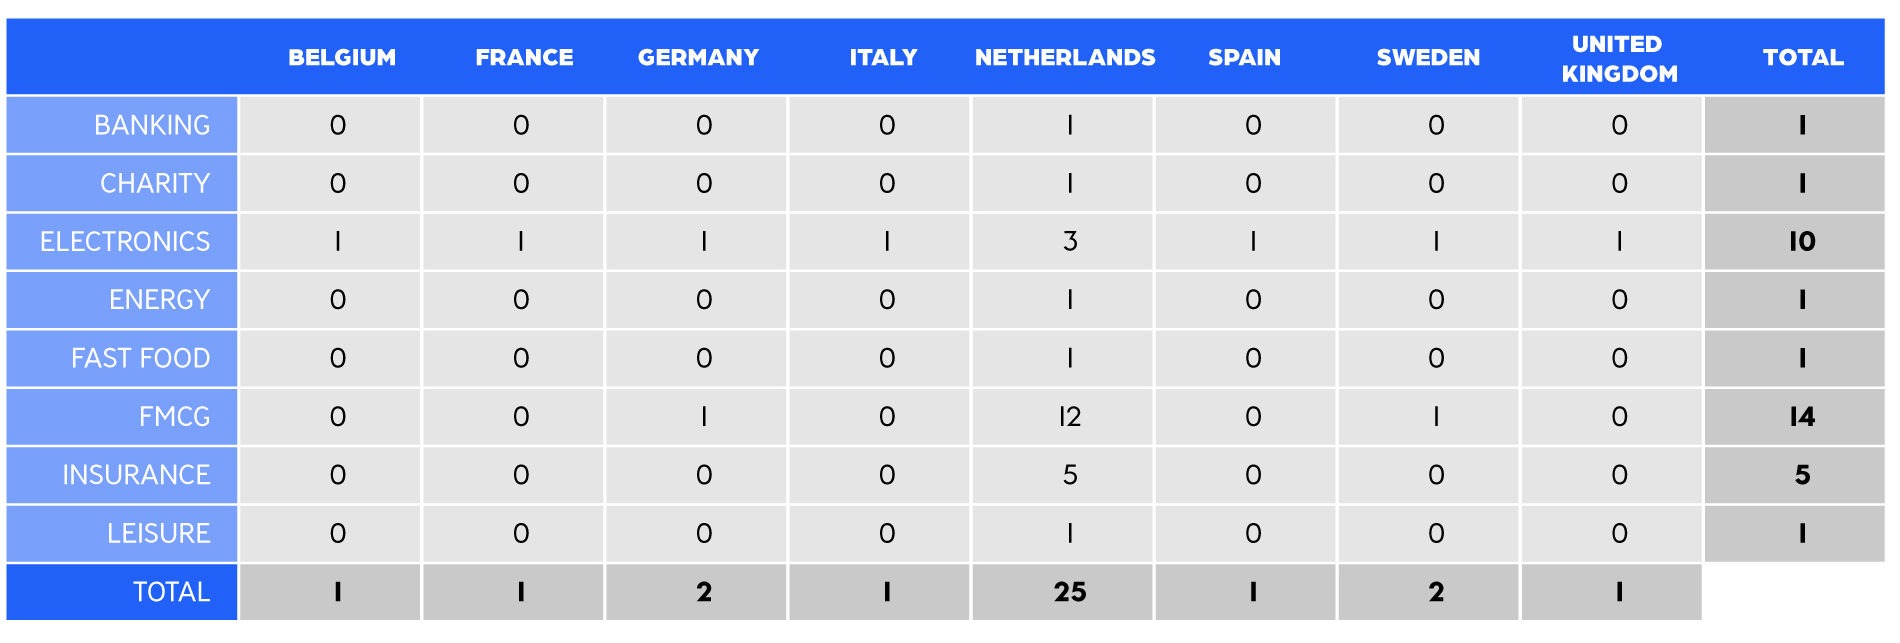
Our data set comprises 34 brands, across 8 product categories and 8 countries. Table 1 below displays which category/country combinations are covered by our data set.
Table 1: Number of brands covered in each category/country combination
The moderating role of the number of channels
In order to assess the role of the number of deployed channels in determining advertising effectiveness, we follow a conceptual model that is visually represented in Figure 1 below:
Figure 1: Conceptual model for the role of the number of channels in determining advertising effectiveness
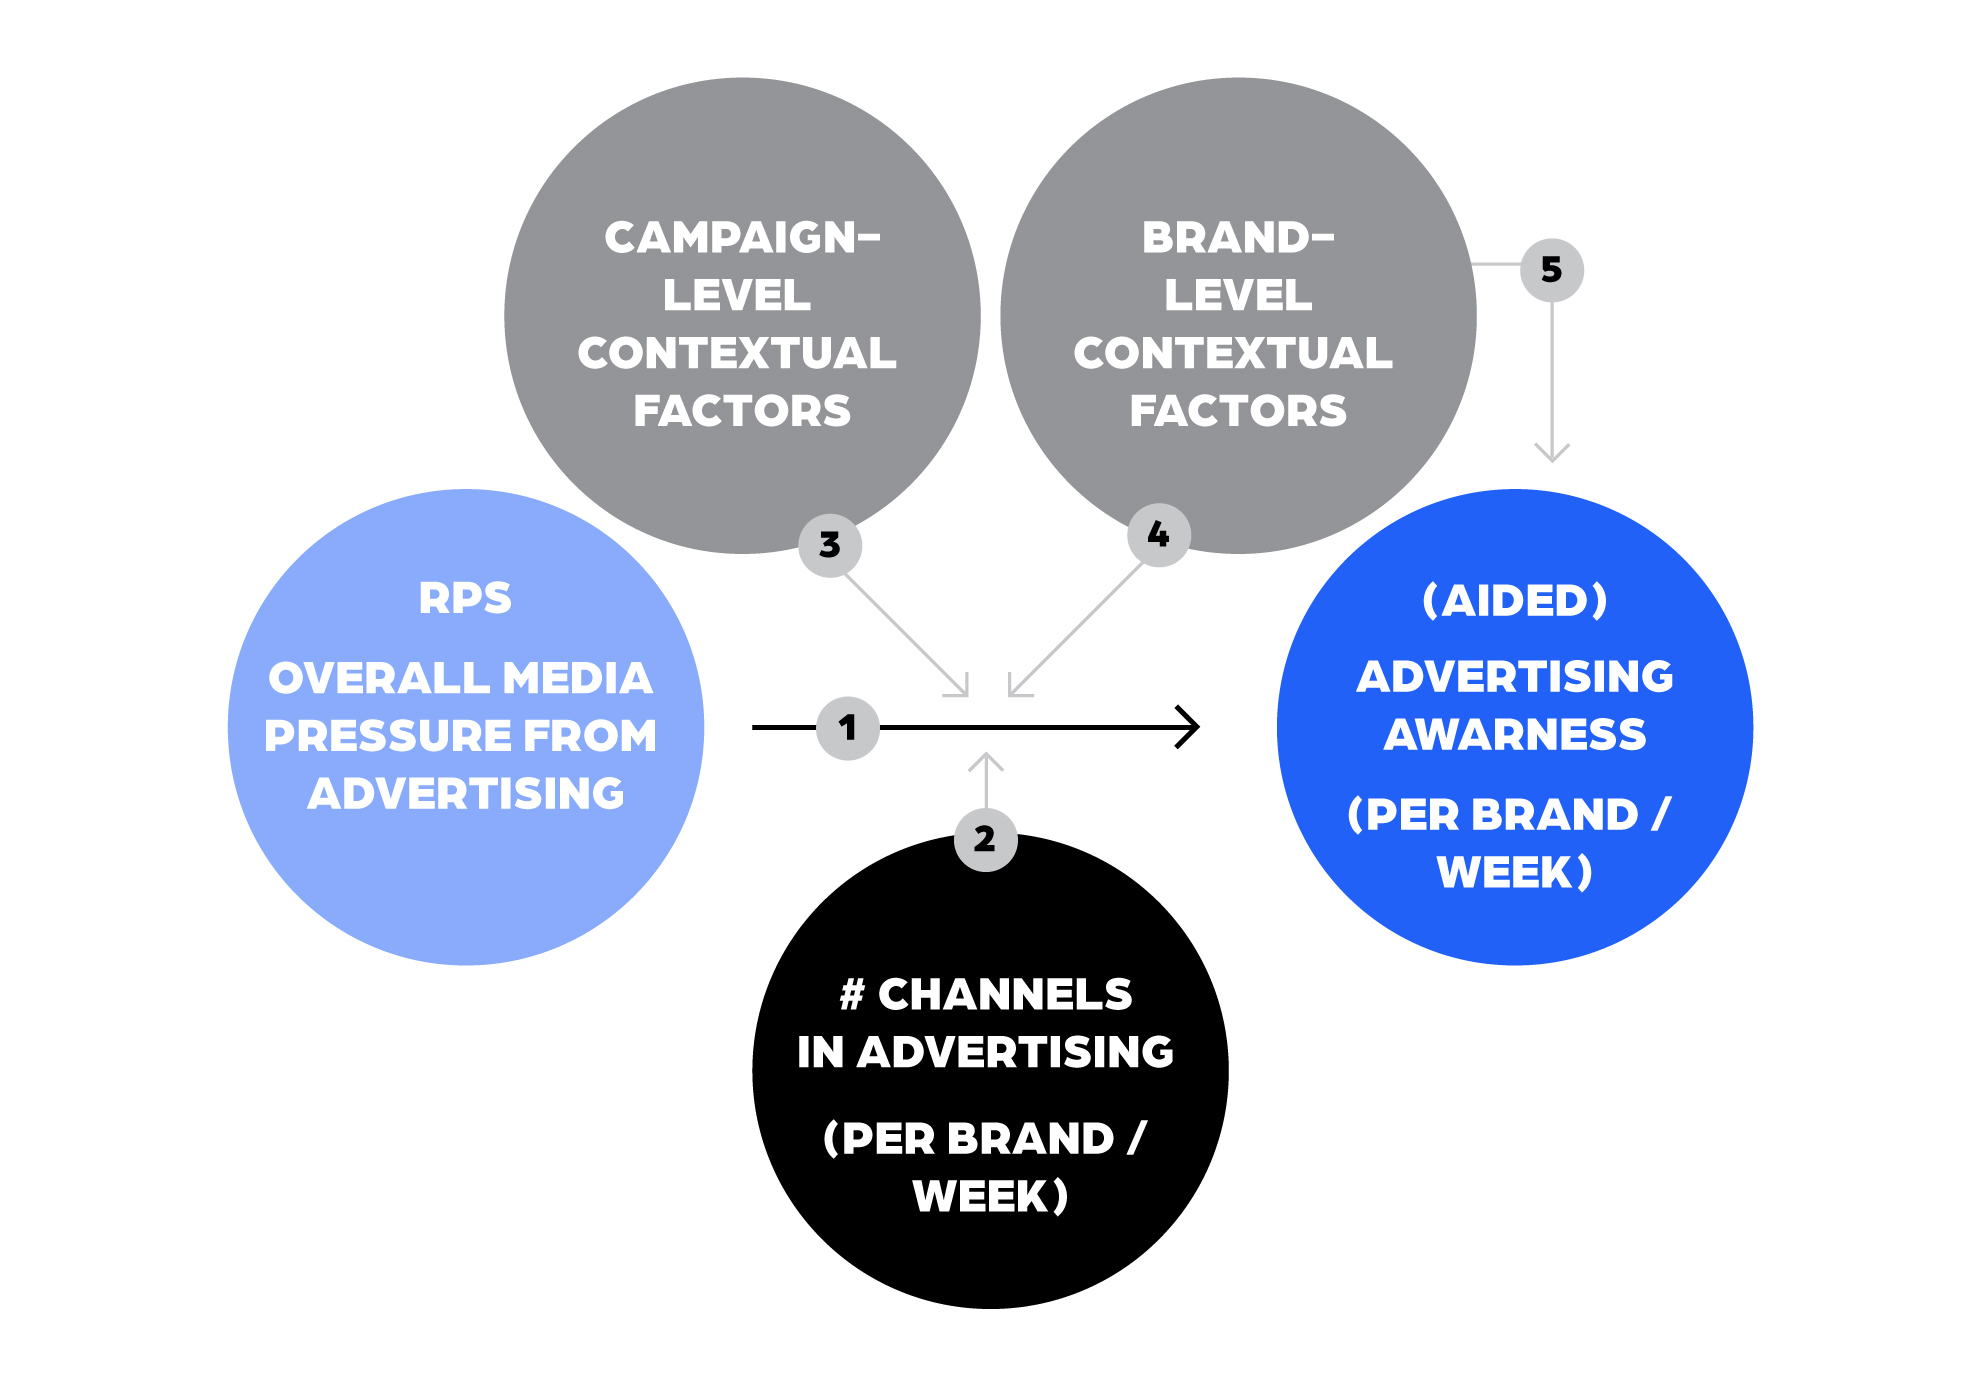
Arrow 1 is the backbone of this model. It represents how a brand´s week-to-week advertising efforts (RPS) subsequently affect consumers’ ability to recall the brand’s media presence (advertising awareness). Thus, arrow 1 represents the impact of advertising, and our conceptual model assumes that the exact magnitude of this impact can depend on several factors.
Following our main research question, we are primarily interested in arrow 2. That arrow symbolises how the number of channels deployed to achieve a certain level of media pressure affects (or in other words, moderates) the effect described by arrow 1, e.g., the impact of that media pressure on advertising awareness.
These relationships will be analysed using a regression model of RPS (independent variable) on advertising awareness (dependent variable), with the number of channels serving as a moderator. Both the RPS and several channels are incorporated into the model through both a linear and a squared term. Through this approach, we remain flexible with regards to the (possible) form of these relationships, such as increasing or decreasing scale effects or “inverted U”-curves.
We expect the effectiveness of advertising to also be highly campaign-specific (e.g., due to differences in creative strength or realised share-of-voice) and/or brand-specific (e.g., as consumers may find it easier to remember advertisements from brands that are well-known). Hence we need to control for these differences in advertising impact (arrows 3 and 4) across brands and campaigns before being able to obtain a reliable estimate of the exact role played by the number of channels.
We do so by estimating the regression model as a so-called “mixed model”. That will estimate the RPS parameters as random rather than fixed effects (across both brands and campaigns, with the latter being defined as isolated periods in time in which media pressure exceeds zero). Moreover, brands can differ considerably in their “base level” of advertising awareness. This means that consumers may still claim to have seen or heard advertising of (strong) brands even though these brands did not actually advertise for a while. Therefore, we follow a similar random-effect approach for the model’s “intercept” as well (arrow 5).
Searching for an optimum: What number of channels works best?
First, we estimated the regression model described above. Afterwards, as expected, we found that brands vary considerably in terms of their base level of advertising awareness – with the minimum and maximum levels amounting to 2% and 51%, respectively. This essentially means that, depending on the brand, up to ±50% of consumers may claim to have recently seen and/or heard advertising of the brand – even though no campaign was running at that point in time.
We also found considerable variability in how this advertising awareness is impacted by RPS. A level of weekly media pressure corresponding to one contact (on average) with each person in the target group is found to result in an uplift in advertising awareness of anywhere between 0.1 and 2.3 percentage points. As such, this confirms the importance of controlling for brand- and campaign-specific differences.
Next, we turn our attention to how the (average) impact of media pressure on advertising awareness depends on the number of channels on which one advertises. To do so, we use the model’s parameters to compute expected uplifts in advertising awareness under different amounts of channels and degrees of (weekly) media pressure. For the latter, we define a “very low” level of media pressure as a number of weekly contacts that lie below the vast majority (90%) of campaigns in our data set. We also define a “very high” level of media pressure as a number of weekly contacts that lie above the vast majority (90%) of campaigns in our data set. The “low”, “medium” and “high” levels are then scaled between the “very low” and “very high” levels, using the exact same step size between each pair of levels.
Figure 2 displays the results of these computations. Please note that for each of the five levels of media pressure, we only compute expected uplifts for channel amounts that we actually observe for that level in the data set.
Figure 2: Expected uplifts in advertising awareness under different levels of media pressure and amounts of channels (used to realise this media pressure)
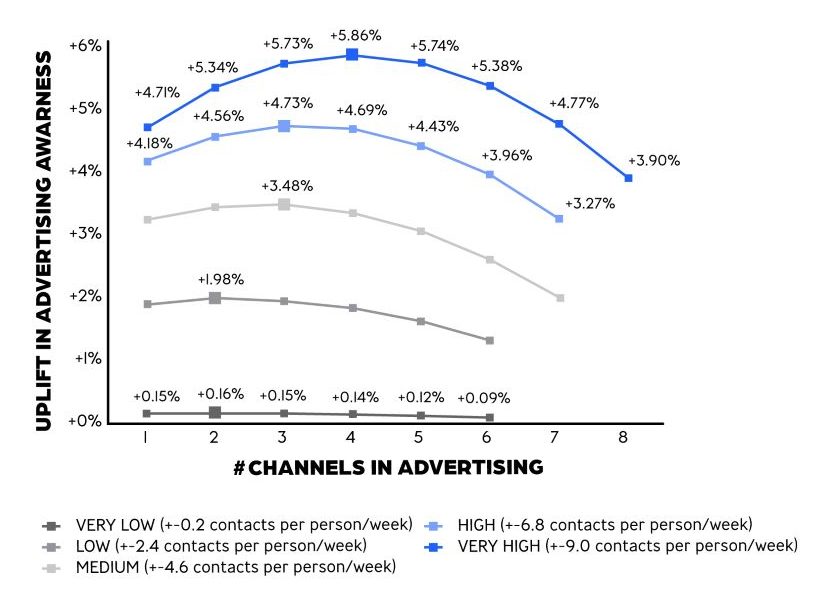
A first striking result is that when we move from the “very low” level of media pressure towards the “very high” level, each increase in level results in a smaller increase in the advertising awareness uplift (as the lines in the graph become increasingly close to one another) – despite the fact that the increase in actual media pressure was always the exact same. This signifies the existence of decreasing “returns to scale”. The more one advertises the more these additional efforts will result in reaching the same consumers with a higher frequency rather than reaching new consumers, and the lower the additional impact on advertising awareness will be.
Next, we move to the actual role played by the number of channels. Under very low (weekly) media pressure, despite the optimum number of channels formally lying at 2, we essentially see no difference in effect size (as it’s always very close to +0%) across the different amounts of channels. This level of media pressure is likely always too low to have any substantial impact on advertising awareness, regardless of the number of channels used to realise it. However, from here, the higher the level of media pressure, the clearer an optimum is revealed in terms of the number of channels to be used.
Below this optimum amount, one may not (yet) be noticed by those consumers that can only be reached by adding certain channels to the media mix (e.g., young “digital-only” consumers). Above this optimum amount, however, one is less likely to “break through the clutter” on the channels on which one advertises. This is because the number of contacts that can be allocated to each separate channel simply becomes too low. Following this reasoning, it is perhaps not too surprising that we do see the optimum number of channels increase along with the level of media pressure – going from 2 channels at a low level, to 3 channels at a medium or high level, and to 4 channels at a very high level. The higher the overall media pressure behind a campaign, the more channels one can allocate a sufficient number of contacts to in order to “break through”; capitalising on the additional consumers that one is able to reach this way.
At the same time, it should be emphasised that while we observe numerous campaigns using the “full spectrum” of eight channels, the optimum number of channels to boost advertising awareness never seems to exceed four – even at very high levels of media pressure. This suggests that within a considerable number of campaigns, brands might be “spreading themselves too thin” for their advertising to truly stand out on each of the channels in their media mix – leading to a lower share of consumers that are able to remember the campaign for a prolonged amount of time.
“A balance of channels”
The results of our meta-analysis reveal that the effectiveness of an advertising campaign, with a set level of media pressure, may depend on the number of channels that are used to realise this pressure.
Still, the role played by the number of channels remains limited at best for very small-scale campaigns, which experience severe difficulty in “breaking through” among their audience regardless of the exact amount of channels used. However, selecting the optimal number of channels starts to make more of a difference (and thus becomes increasingly important) the larger a campaign is in terms of media pressure.
Finding this optimum is first of all a matter of adding enough channels to the media mix to get in contact with those consumers that wouldn’t be reached otherwise. At the same time, one should also avoid the trap of spreading the advertising budget over too many channels for them to remain effective in breaking through the clutter.
As one’s campaign increases in scale, so does the number of channels that can feasibly be incorporated to achieve maximum effectiveness. At the same time, we find that this number never tends to exceed four, even under very high media pressure. As a result, it is perhaps not too surprising that we observe many campaign weeks (about 40%) in our data set that either “under- or over-utilise” the number of channels available to them. This leads to sub-optimal memorisation of the campaign among its intended audience.
Of course, we should note that in this study, our operationalisation of campaign effectiveness was based on uplifts in advertising awareness, which is not a typical end objective. Still, the first key to a successful campaign often lies in its ability to be memorised by its intended audience, and in that sense, we conclude that “less” can very well be “more”. This underlines the importance of a well-thought-out decision on what channels to include in – and exclude from – the media mix. Stay tuned for a follow-up to this meta-analysis later this year, in which we will provide more insights into this matter!