
A new deliverable portal
Published on 18 06 2020DVJ Insights strongly believes that engaging workshops are the most effective way to turn research results into action. In the workshop, DVJ Consultants will provide input & recommendations on the best direction for activation by following the FUA structure. On top of that, we also have a suite of online platforms available which help bring insights to life.
- Existing Reality Analytics Platform – Monitoring Tool: For continuous research we have developed a tool that follows performance over time. In this dashboard you upload other data sources, and it has a tailored tool for campaign evaluations and media planning. It is designed to support marketers to monitor brand position, to evaluate campaign and plan media better.
- Existing Insight Portal – Storytelling Analysis Tool: To get better and deeper understanding we use a lot of open techniques like storytelling and free associations. You can explore all stories and associations that were collected during a study with our unique storytelling tool, including translations, key word searching and subgroup filters. You can even create your own storybook! This tool helps you to dig deeper into the more qualitative results of a study.
- New – Table Reporting Tool: Our Table reporting is a new online report with tables and graphs of all the results. The DVJ researcher creates an online report that can easily be viewed by our clients. In the portal it is easy to do the same for other splits and copy this to PowerPoint and Excel. The results are always available within 48 hours after finishing the fieldwork.
New – table reporting tool
The online reporting tool is a new tool of DVJ where DVJ researchers prepare an online report that can be viewed online. You can request all quantitative data through our online table report. Simply select the metrics and subgroups you want to use and export the table report to Excel where significance tests are included.
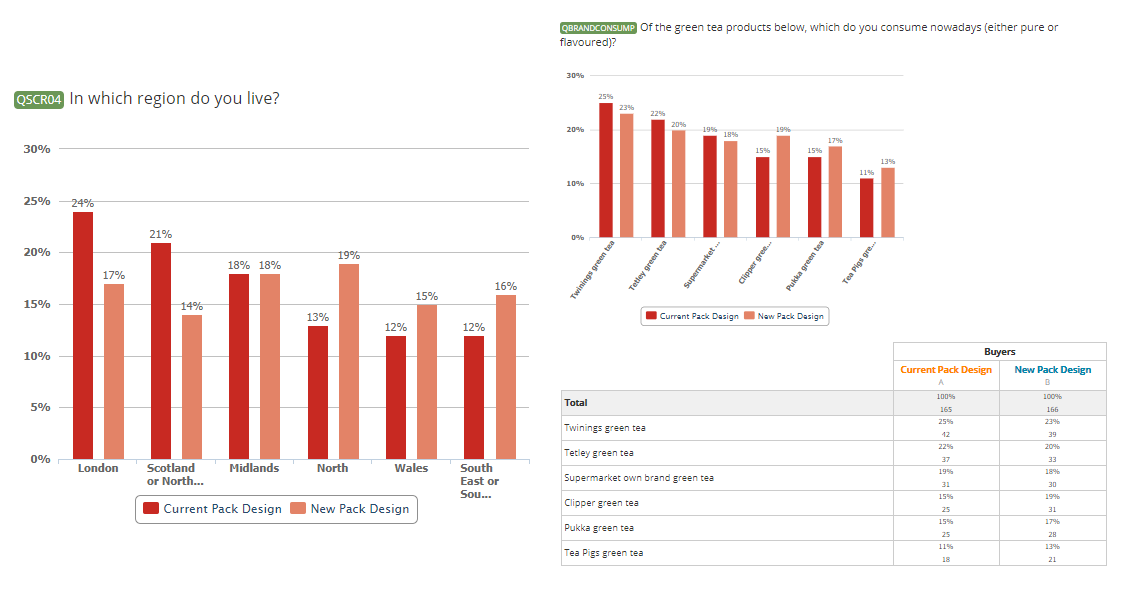
Figure 1
All the graphs and tables can be reworked (rank, change colour, etc) and be copied to Excel or PowerPoint. That means that every report can be created in a matter of minutes.
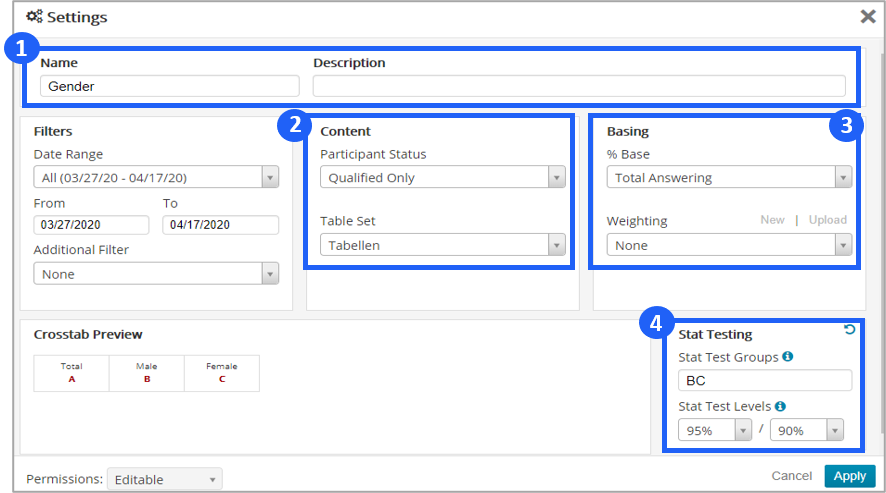
Figure 2
The online portal also has the possibility to create your own analyses based on different background variables. This means easy access to all possible splits. Especially for clients that like to dig deeper into the data, this tool is an excellent way to learn more.